[EC2 Monitoring] AWS CloudWatch로 Custom 알림 받기, EC2 디스크사용률 경보
안녕하세요.😊
디스크 사용량 경보를 받을 수 있도록,설정해보겠습니다.
[순서]
1. EC2에 CloudWatch 사용할 수 있는 권한 있는지 확인 & 설정
2. EC2에 amazon-cloudwatch-agent 설치
3. CloudWatch 콘솔에서 지표 확인 후 경보 설정
1. EC2에 CloudWatch 사용할 수 있는 권한 있는지 확인 & 설정
먼저, Ec2에 역할이 설정되어있는지 부터 확인합니다.
EC2콘솔(https://console.aws.amazon.com/ec2/)에 접속합니다. 인스턴스 목록에서 설정하려는 인스턴스를 클릭합니다.
하위탭이 활성화 되면, 보안탭에서 IAM 역할을 확인합니다.

IAM 역할이 없는경우 ⬇여기⬇를 클릭하여 역할을 할당합니다.
- https://console.aws.amazon.com/iam/에서 IAM 콘솔에 접속합니다.
- 탐색 창에서 [역할]를 선택한 후 [역할 만들기]을 선택합니다.
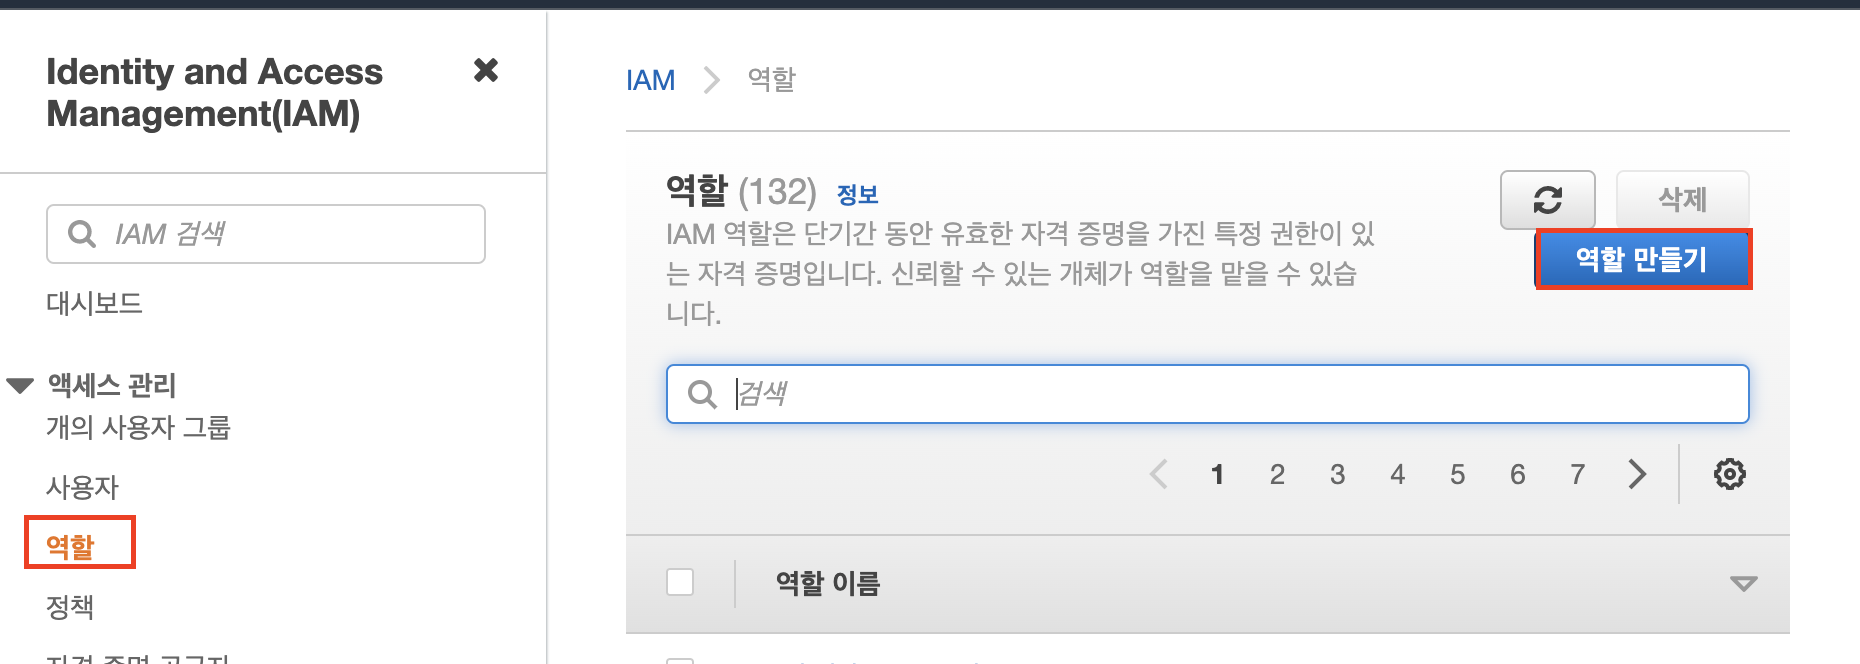
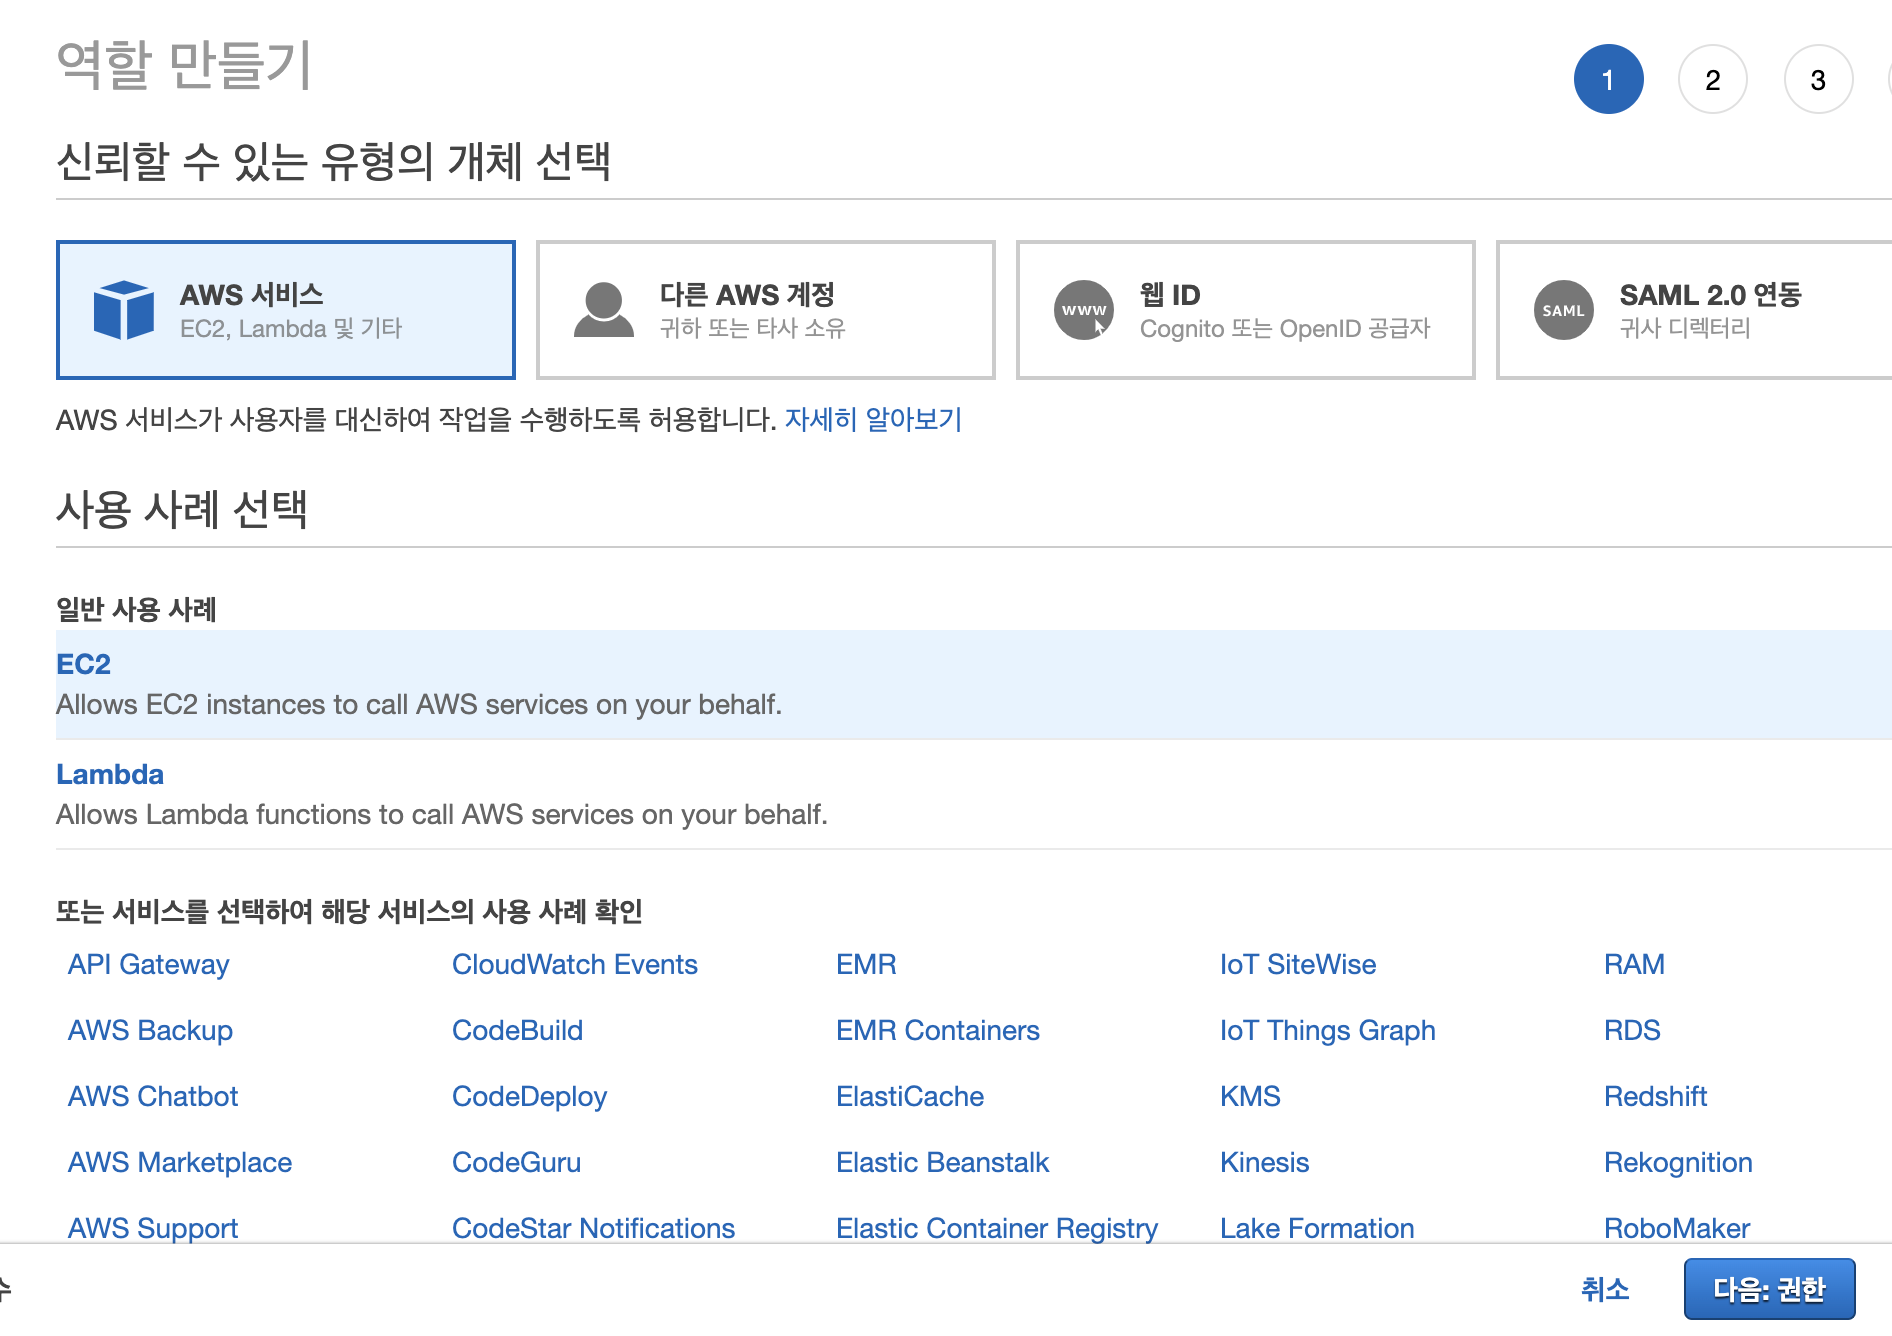
- AWS 서비스 > EC2를 클릭하고, 다음으로 넘어갑니다.
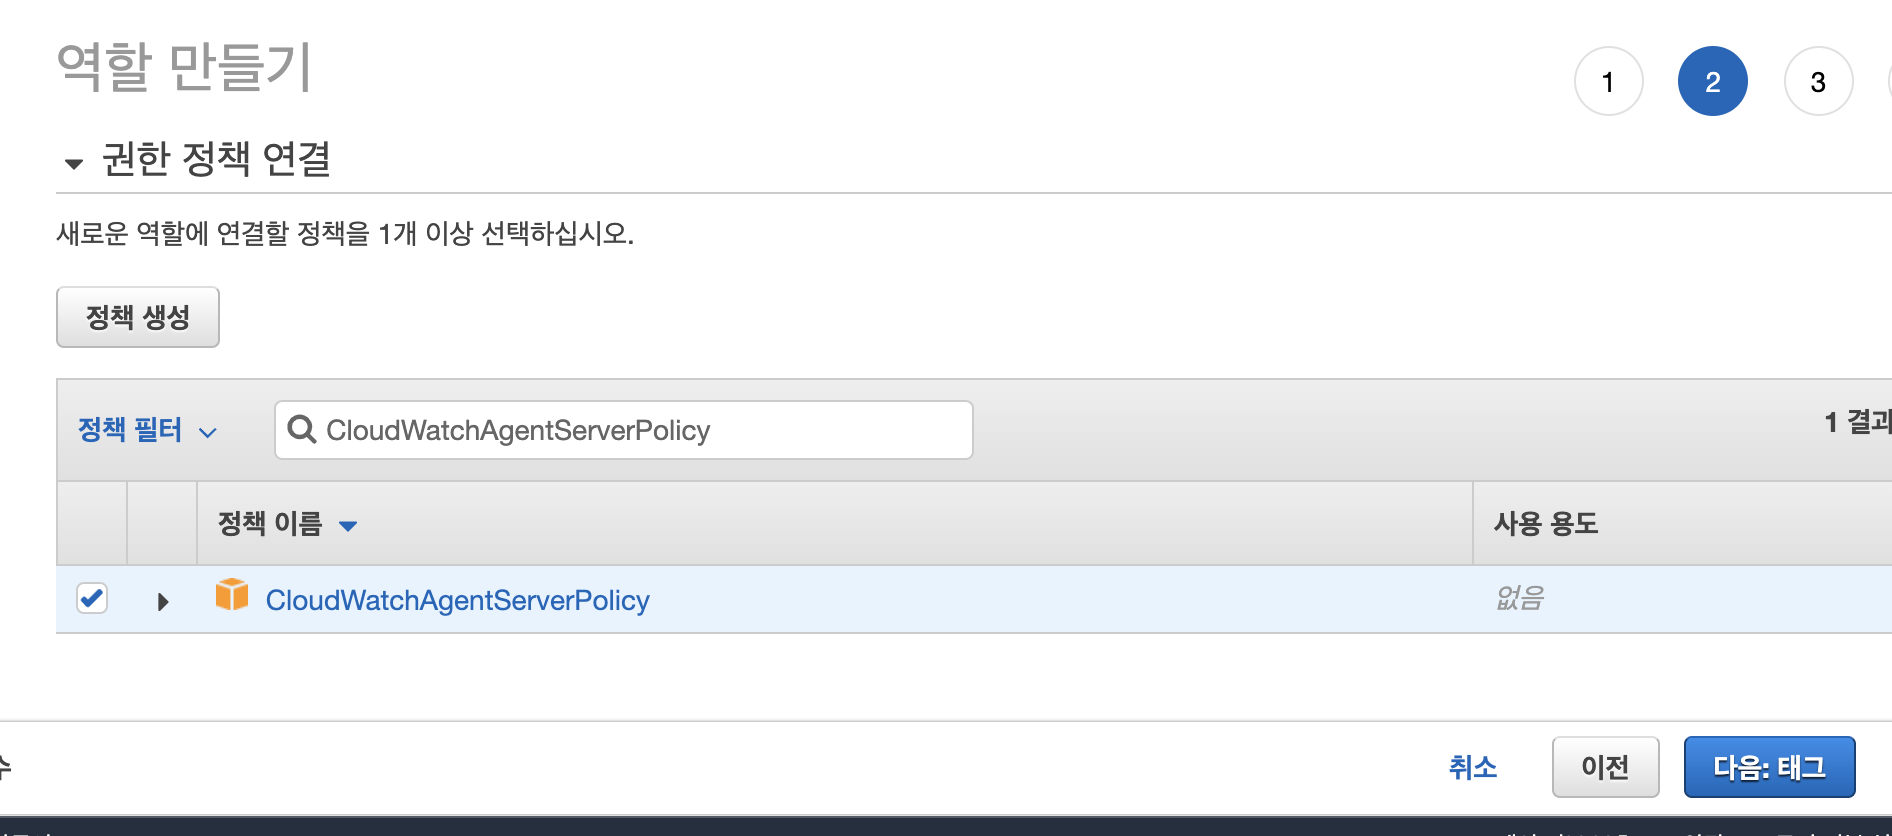
- CloudWatchAgentServerPolicy 정책을 선택하고 다음으로 넘어갑니다.
- 태그는 패스합니다~!
- 역할 이름에 새 역할의 이름을 입력합니다. 저는 my-ec2Role로 넣었습니다!!
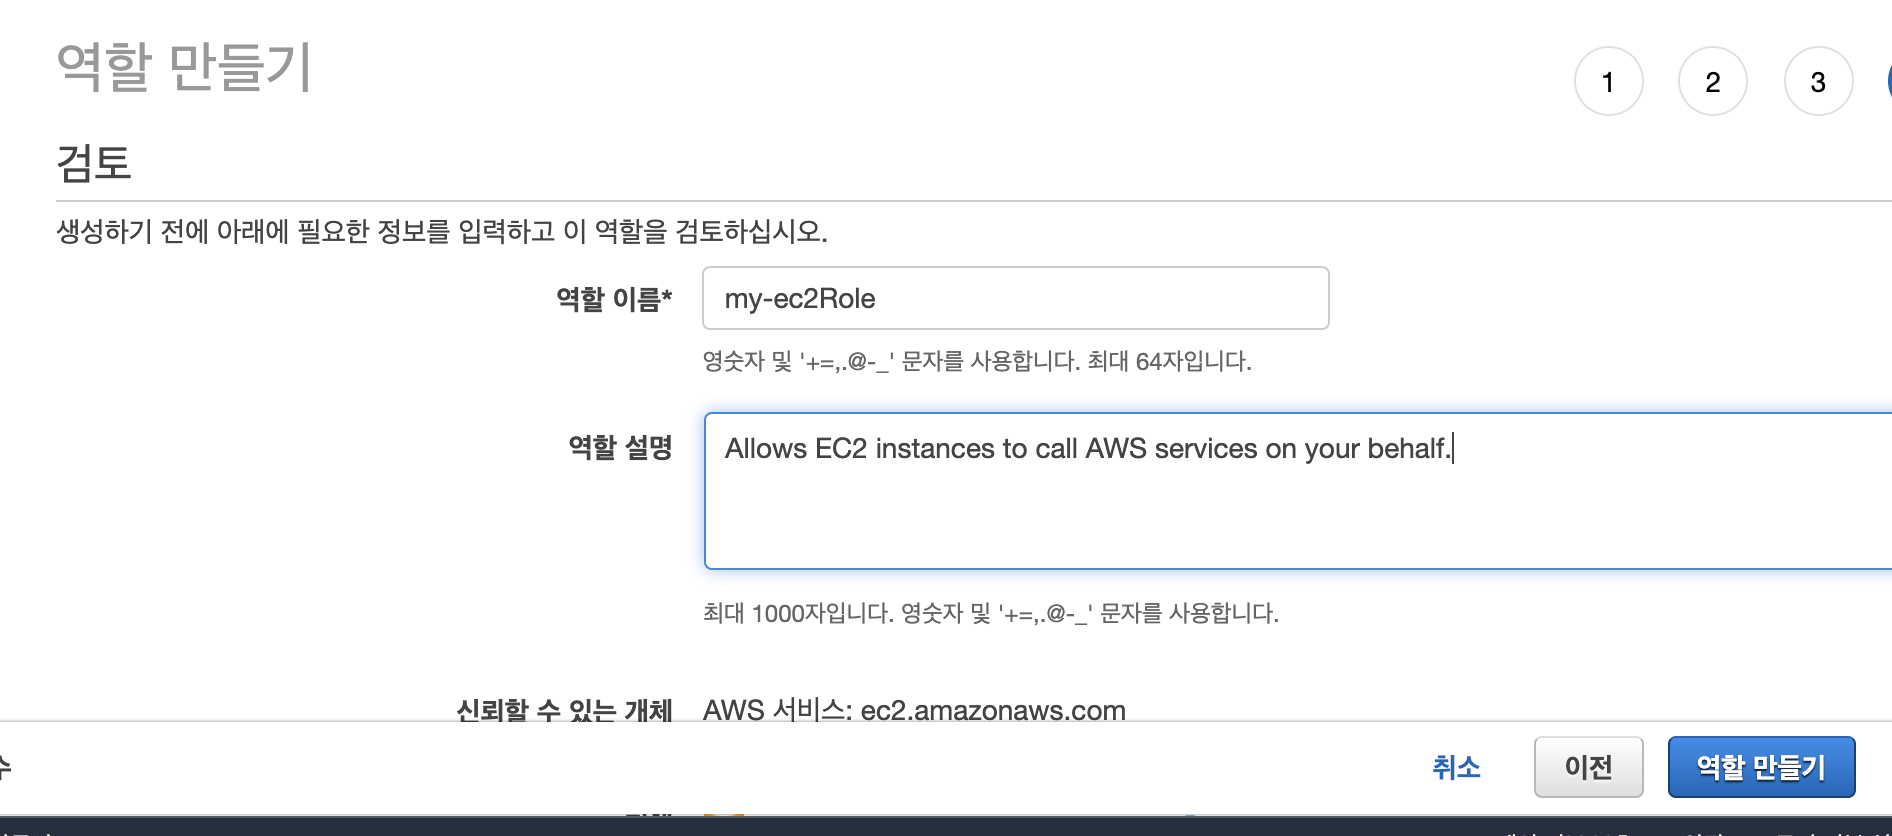
- 역할 생성을 클릭합니다!
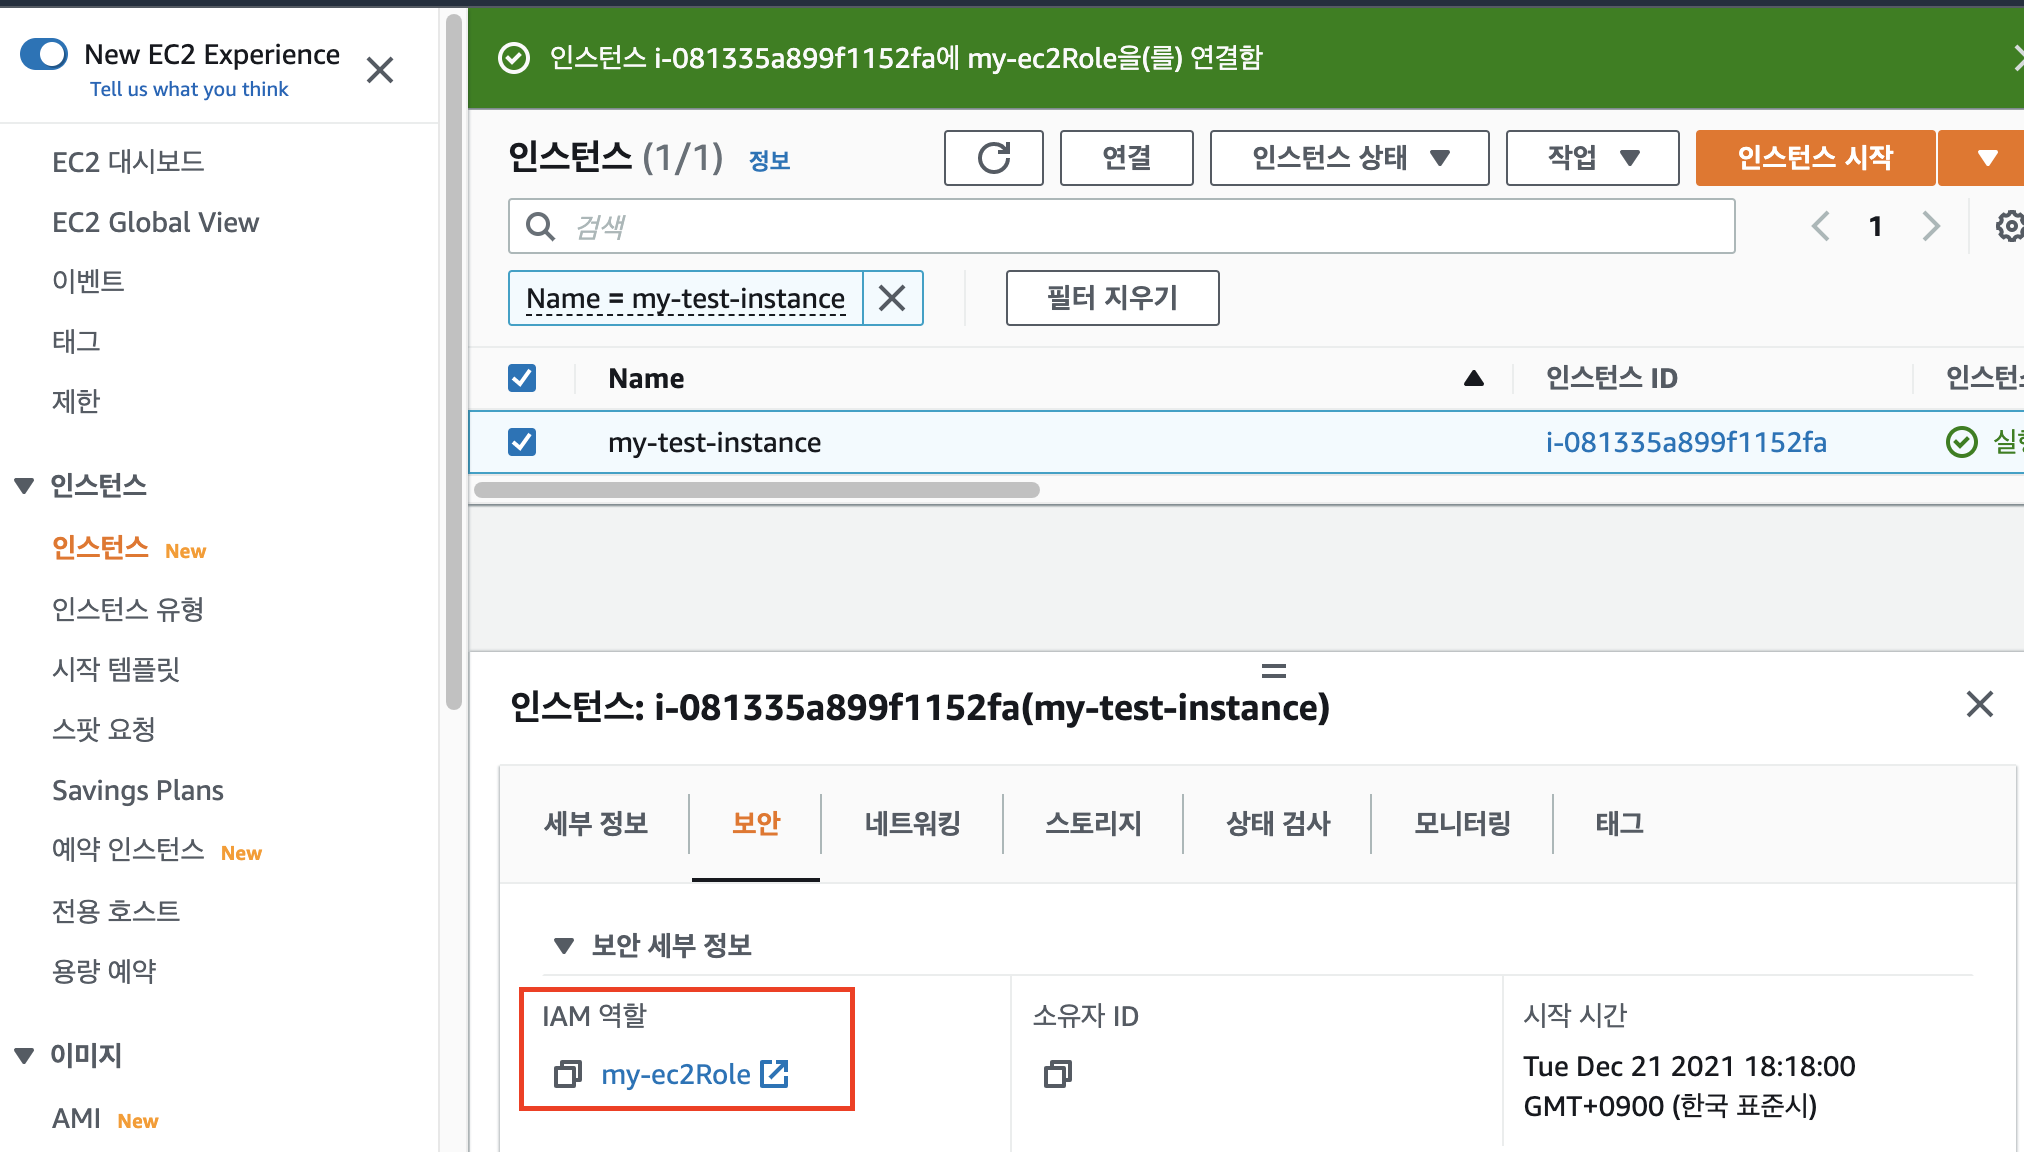
- EC2콘솔(https://console.aws.amazon.com/ec2/)로 이동하여, 해당 인스턴스에 역할을 설정합니다.
작업 > 보안 > IAM 역할 수정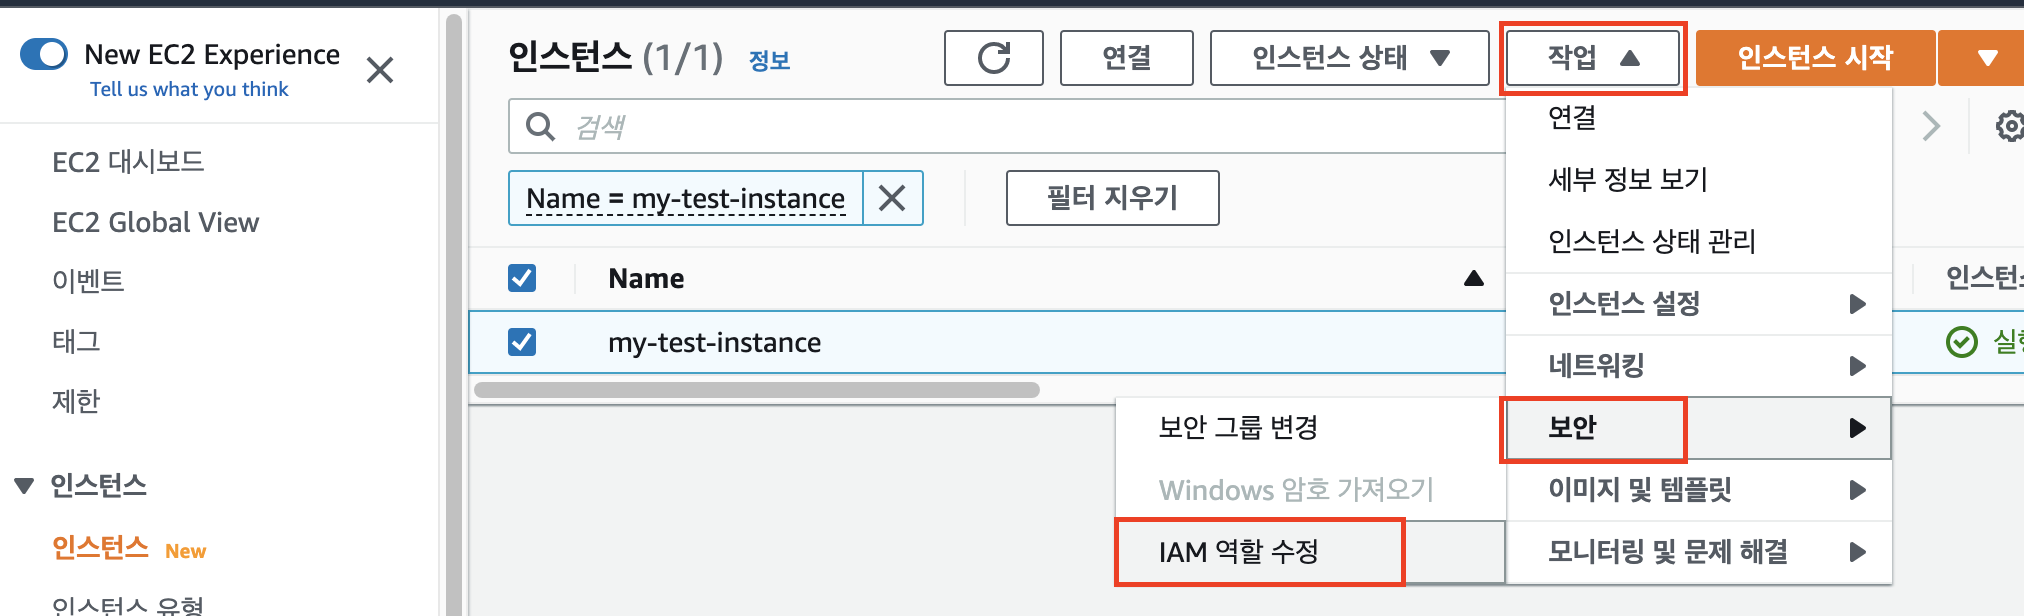
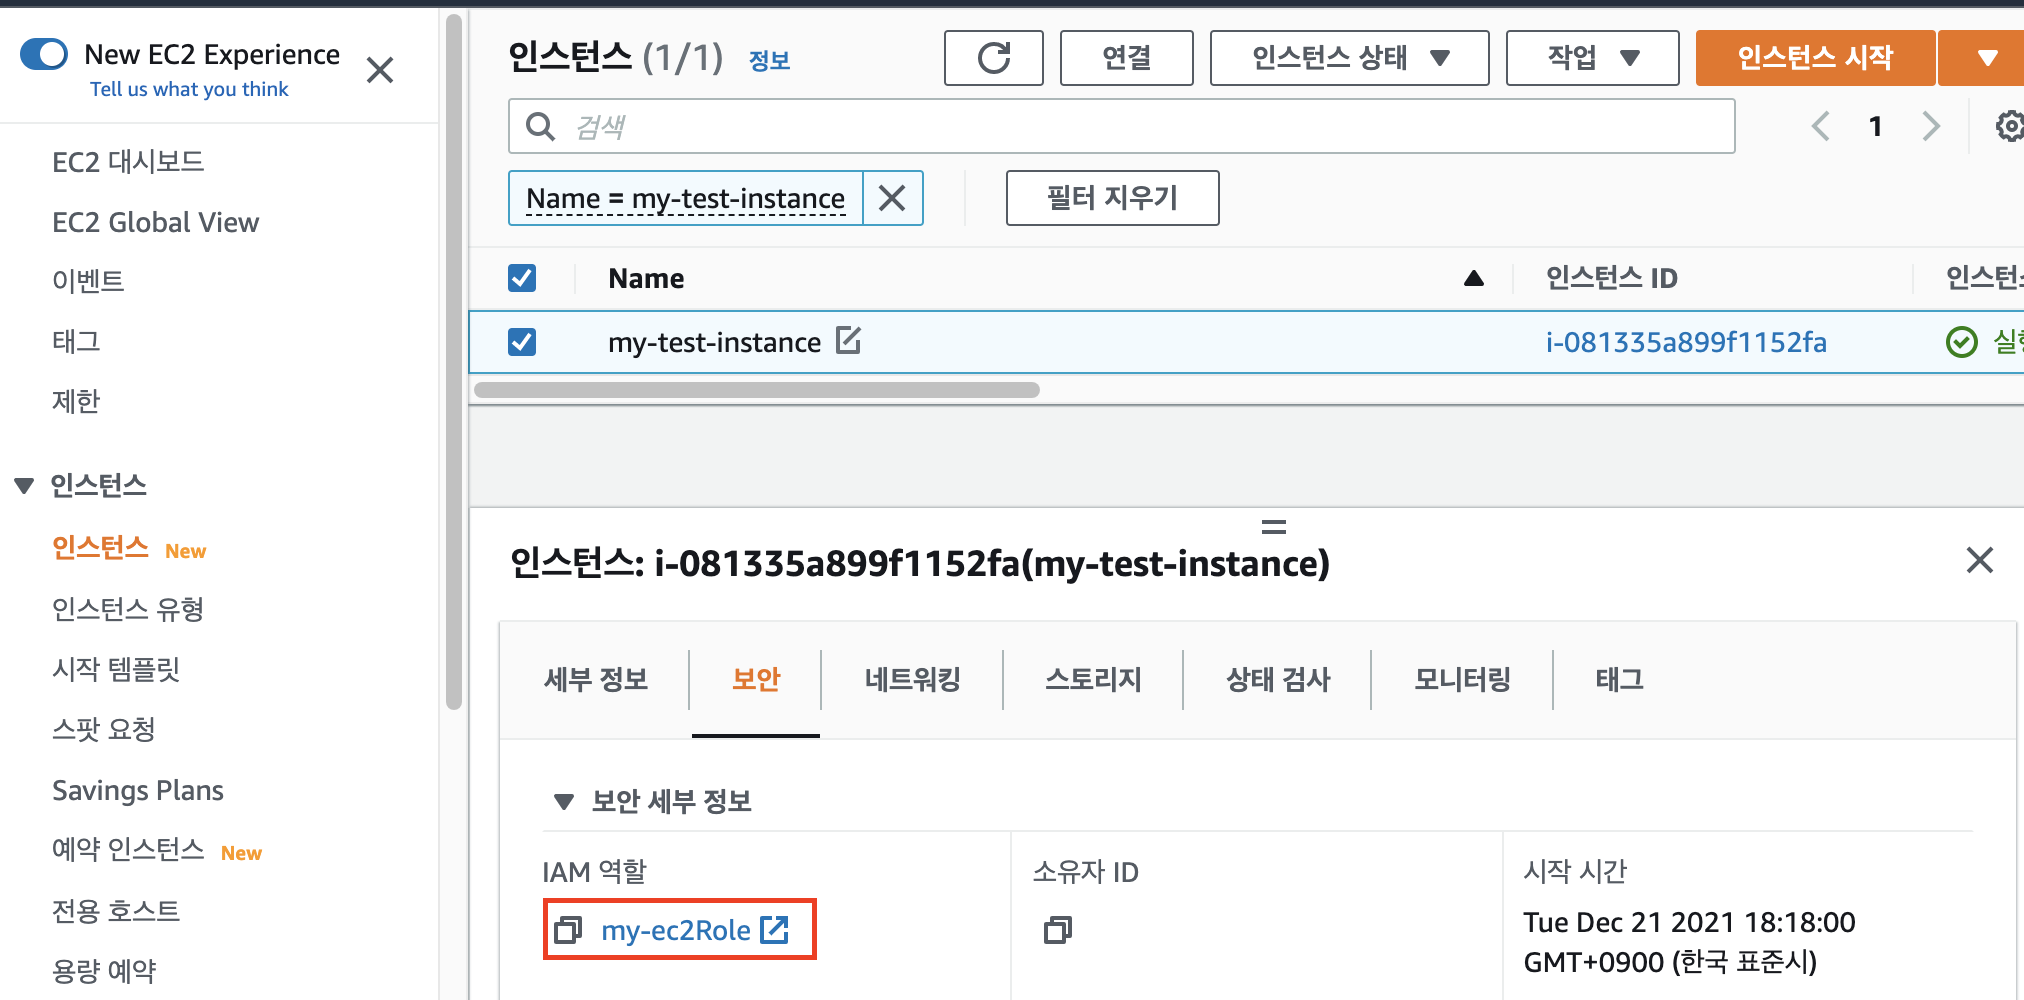
- 역할 잘 할당되었는지 확인합니다. 저는 my-ec2Role 역할이 잘 들어가있네요 ^.^
IAM 역할이 있는 경우 ⬇여기⬇를 클릭하여 역할에 올바른 권한이 있는지 확인하고 설정합니다.
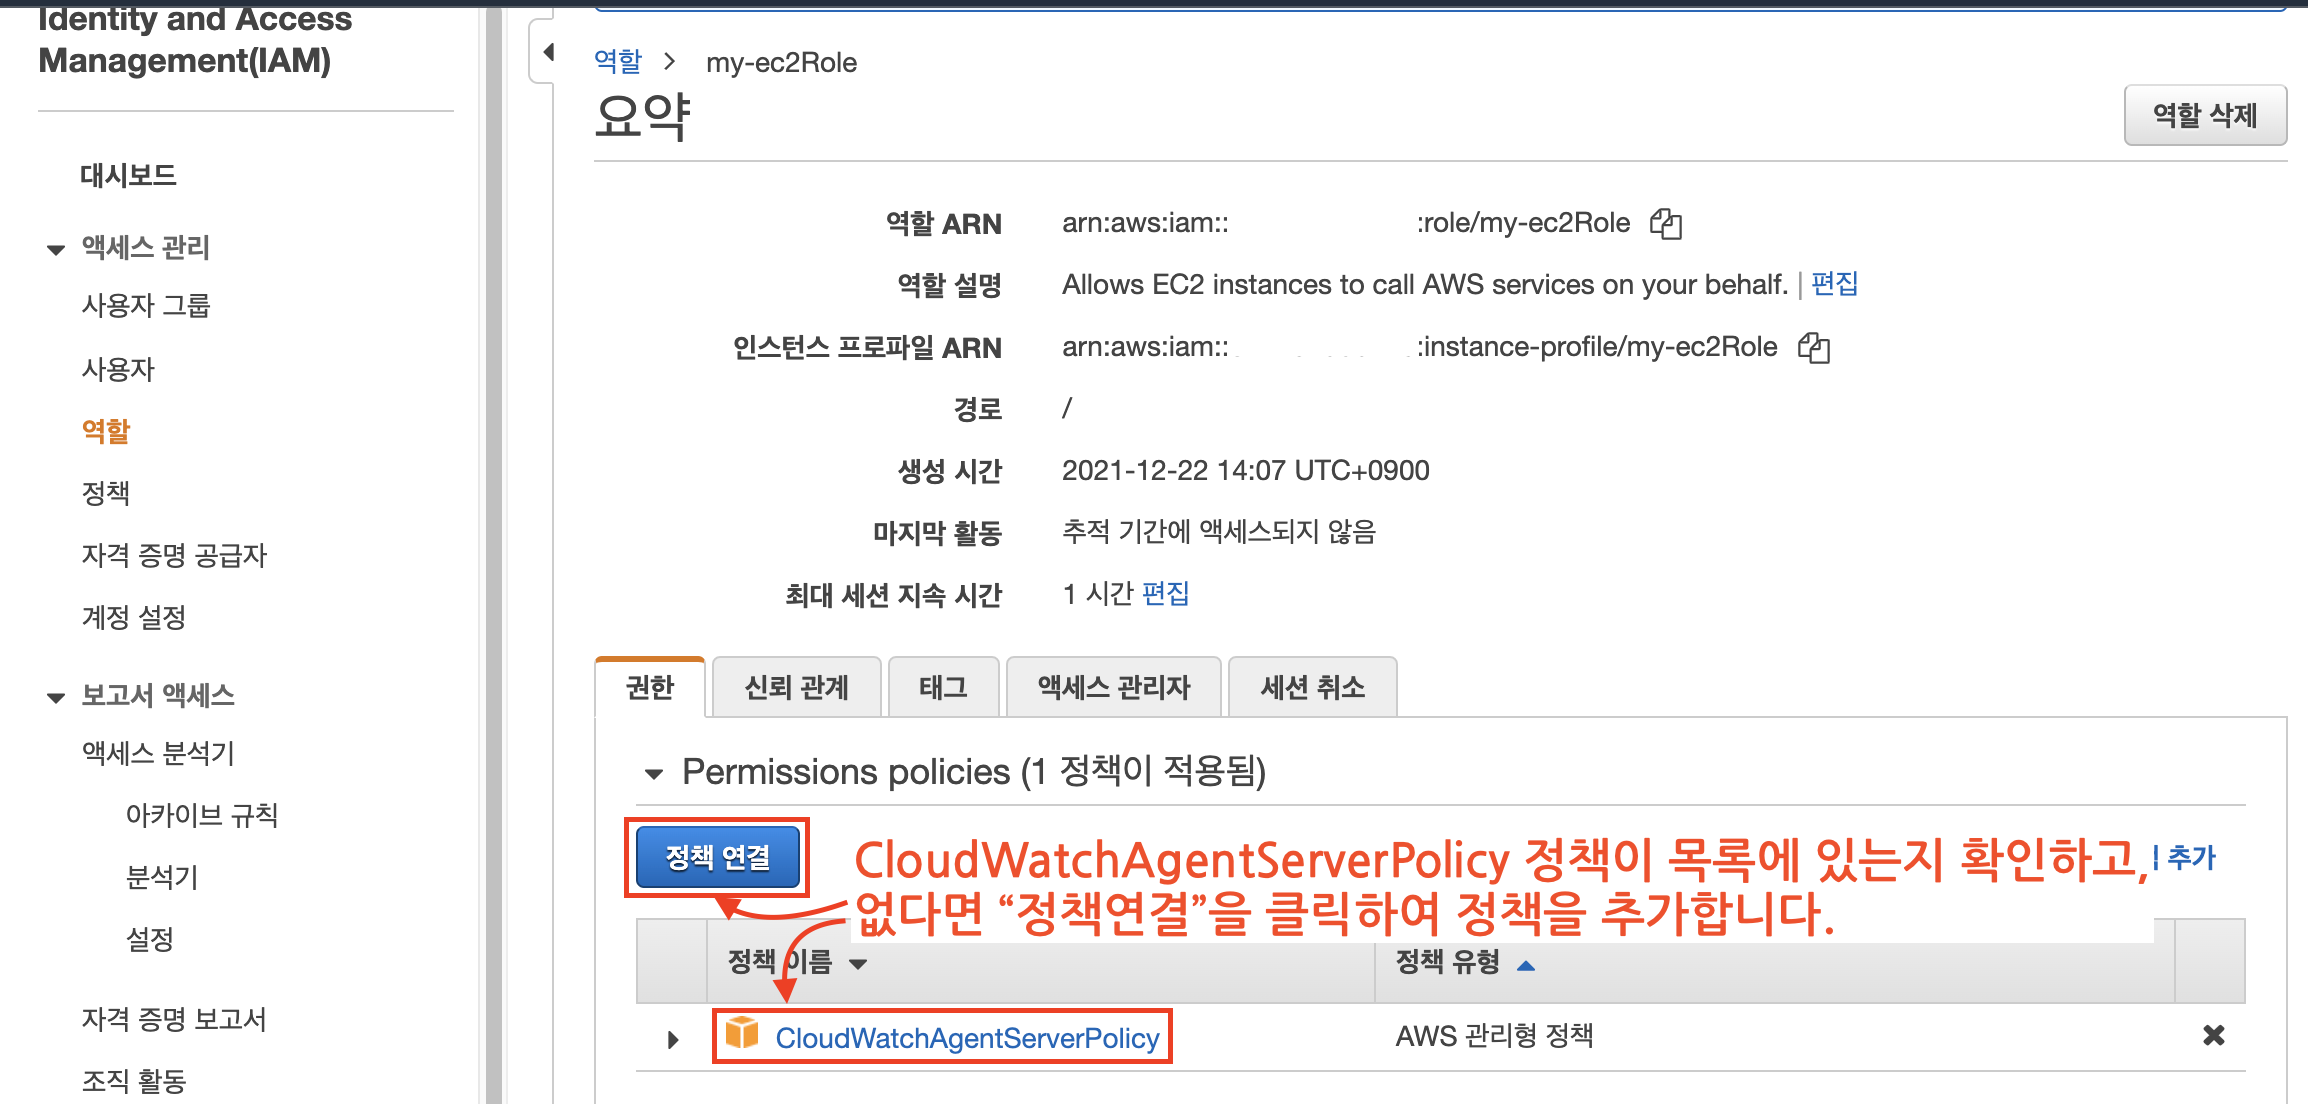
- EC2에 할당되어있는 역할을 클릭합니다.
- IAM 콘솔로 이동된 후 권한 목록에서 CloudWatchAgentServerPolicy 정책이 목록에 있는지 확인합니다.
정책이 목록에 없다면, "정책 연결"을 클릭하여 CloudWatchAgentServerPolicy 정책을 추가합니다.
2. EC2에 amazon-cloudwatch-agent 설치
EC2에 접속합니다. (EC2에 접속하는 방법은 별도로 설명하지 않겠습니다😊)
아래 명령어를 순서대로 입력합니다.
Cloudwatch 에이전트를 설치합니다.
sudo yum install amazon-cloudwatch-agent마법사를 이용해서 Cloudwatch 설정을 생성합니다.
sudo /opt/aws/amazon-cloudwatch-agent/bin/amazon-cloudwatch-agent-config-wizard명령어 실행 시 입력해야 하는 부분은 아래 ⬇더보기⬇ 를 클릭하여 확인할 수 있습니다.
확인하기 쉽도록 빨간색으로 표기하였습니다. 빨간색 글씨로 된 부분만 순서에 따라 입력하시면 됩니다.
=============================================================
= Welcome to the AWS CloudWatch Agent Configuration Manager =
=============================================================
On which OS are you planning to use the agent?
1. linux
2. windows
3. darwin
default choice: [1]: 1
Trying to fetch the default region based on ec2 metadata...
Are you using EC2 or On-Premises hosts?
1. EC2
2. On-Premises
default choice: [1]: 1
Which user are you planning to run the agent?
1. root
2. cwagent
3. others
default choice: [1]: 1
Do you want to turn on StatsD daemon?
1. yes
2. no
default choice: [1]: 2
Do you want to monitor metrics from CollectD?
1. yes
2. no
default choice: [1]: 2
Do you want to monitor any host metrics? e.g. CPU, memory, etc.
1. yes
2. no
default choice: [1]: 1
Do you want to monitor cpu metrics per core? Additional CloudWatch charges may apply.
1. yes
2. no
default choice: [1]: 2
Do you want to add ec2 dimensions (ImageId, InstanceId, InstanceType, AutoScalingGroupName) into all of your metrics if the info is available?
1. yes
2. no
default choice: [1]: 1
Would you like to collect your metrics at high resolution (sub-minute resolution)? This enables sub-minute resolution for all metrics, but you can customize for specific metrics in the output json file.
1. 1s
2. 10s
3. 30s
4. 60s
default choice: [4]: 4
Which default metrics config do you want?
1. Basic
2. Standard
3. Advanced
4. None
default choice: [1]: 2
Current config as follows:
{
"agent": {
"metrics_collection_interval": 60,
--생략--}
Are you satisfied with the above config? Note: it can be manually customized after the wizard completes to add additional items.
1. yes
2. no
default choice: [1]: 1
Do you have any existing CloudWatch Log Agent (http://docs.aws.amazon.com/AmazonCloudWatch/latest/logs/AgentReference.html) configuration file to import for migration?
1. yes
2. no
default choice: [2]: 2
Do you want to monitor any log files?
1. yes
2. no
default choice: [1]: 2
Saved config file to /opt/aws/amazon-cloudwatch-agent/bin/config.json successfully.
Current config as follows:
{
"agent": {
"metrics_collection_interval": 60,
"run_as_user": "root"
--생략--}
Please check the above content of the config.
The config file is also located at /opt/aws/amazon-cloudwatch-agent/bin/config.json.
Edit it manually if needed.
Do you want to store the config in the SSM parameter store?
1. yes
2. no
default choice: [1]: 2
Program exits now.
서비스를 재시작 합니다.
systemctl restart amazon-cloudwatch-agent3. CloudWatch 콘솔에서 지표 확인 후 경보 설정
CloudWatch 매트릭은 실시간으로 반영되지 않습니다. (위에서 60s로 설정했잖아요!)
이번 단계는 이전단계가 완료된 후 2~3분정도 여유를 두고 진행하는것을 권장 드립니다.
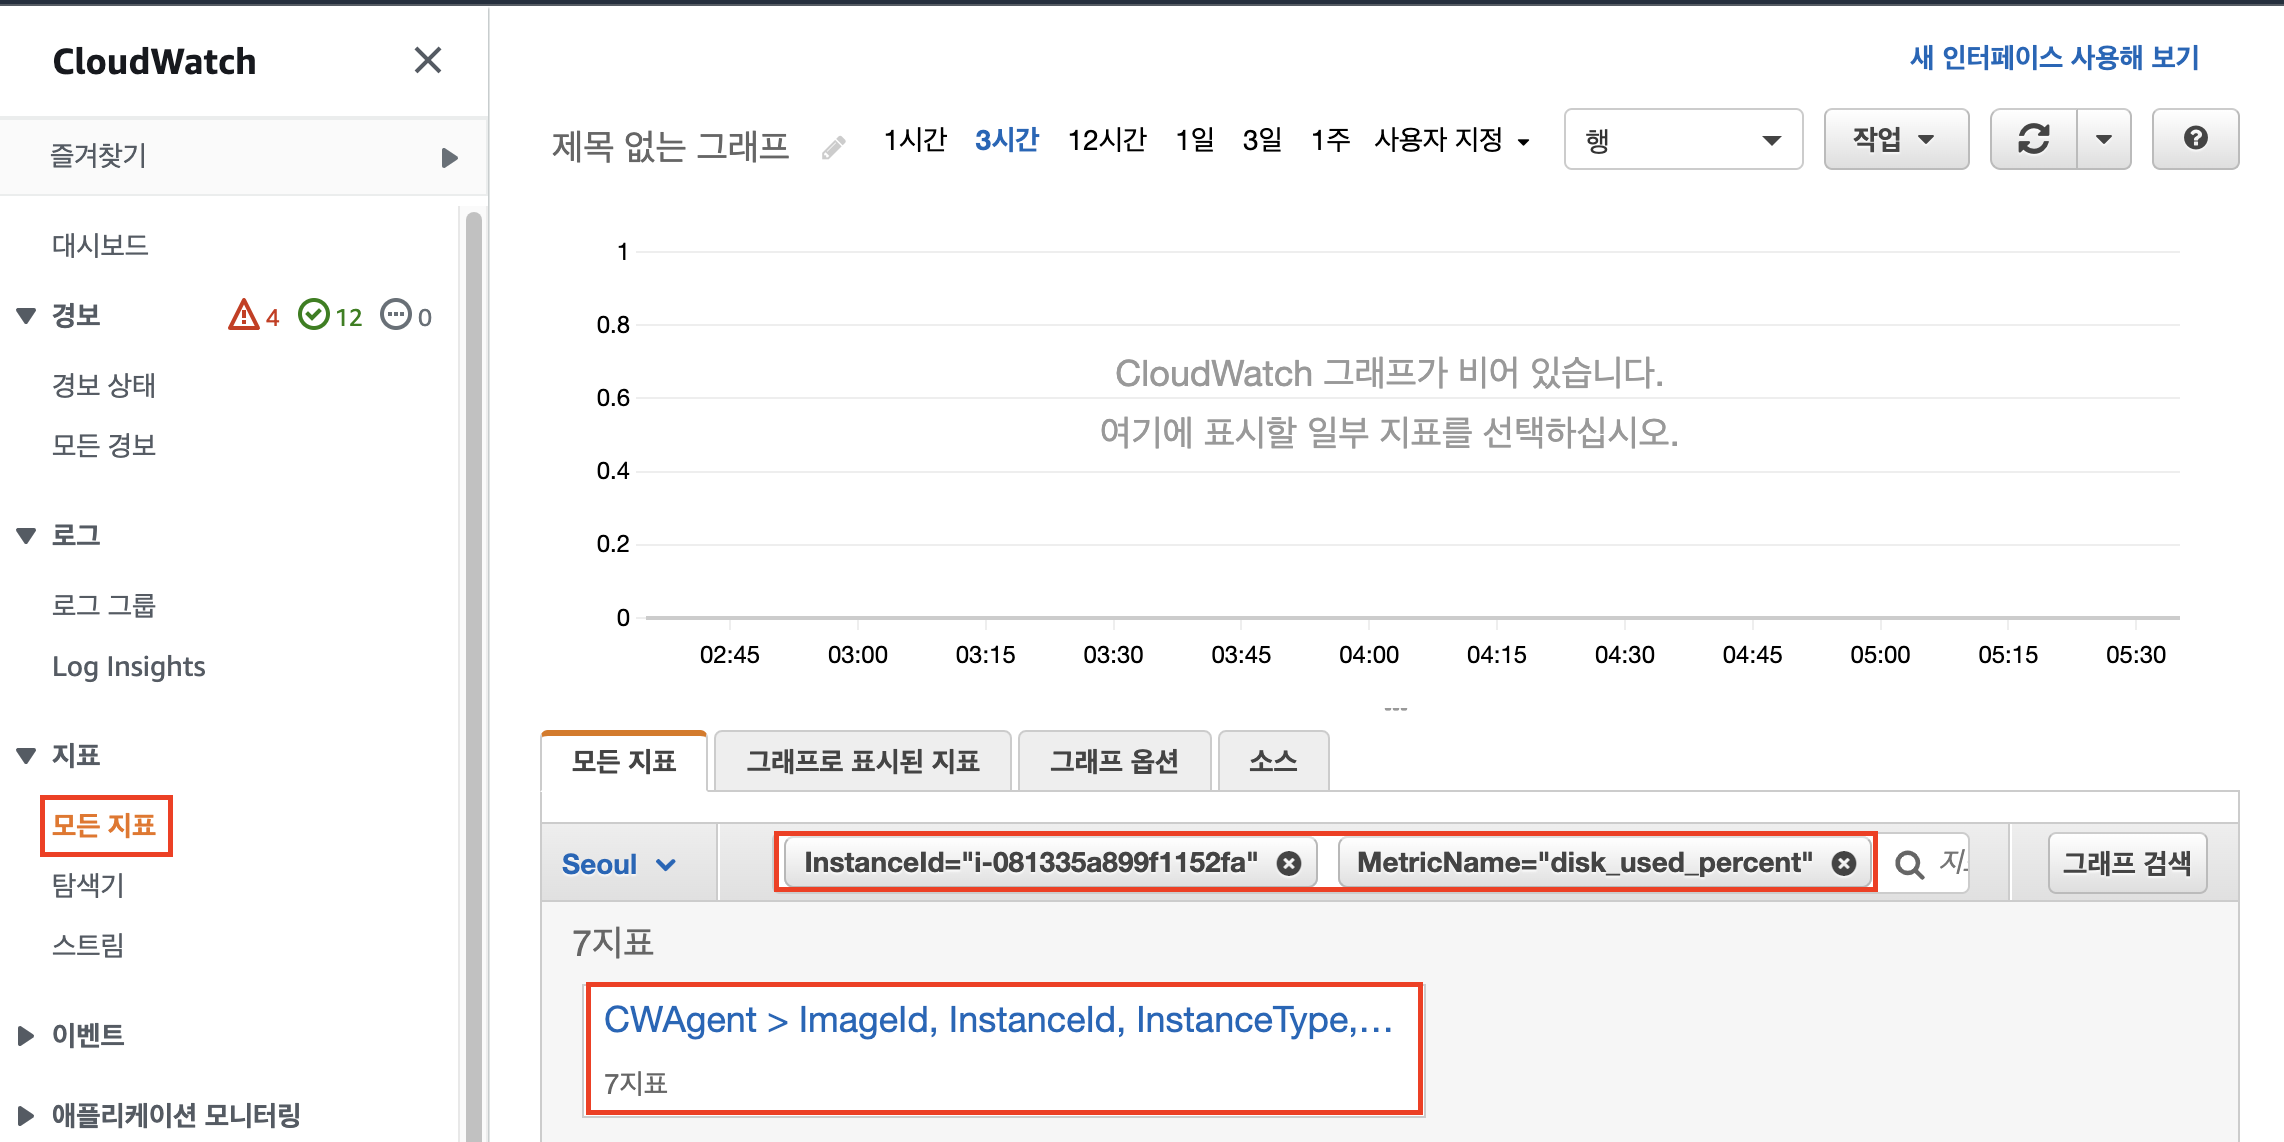
CloudWatch 콘솔(https://console.aws.amazon.com/cloudwatch/)로 이동합니다.
왼쪽 네비게이션바의 "모든지표"를 클릭하고, 검색창에 인스턴스 아이디를 입력하여 검색합니다.
* 검색 키워드 : InstanceId="<인스턴스 아이디>",MetricName="disk_used_percent"
(인스턴스ID는 EC2콘솔에서 확인할 수 있습니다.)
아래 캡쳐화면과 같이 사용자지정 네임스페이스를 클릭합니다.
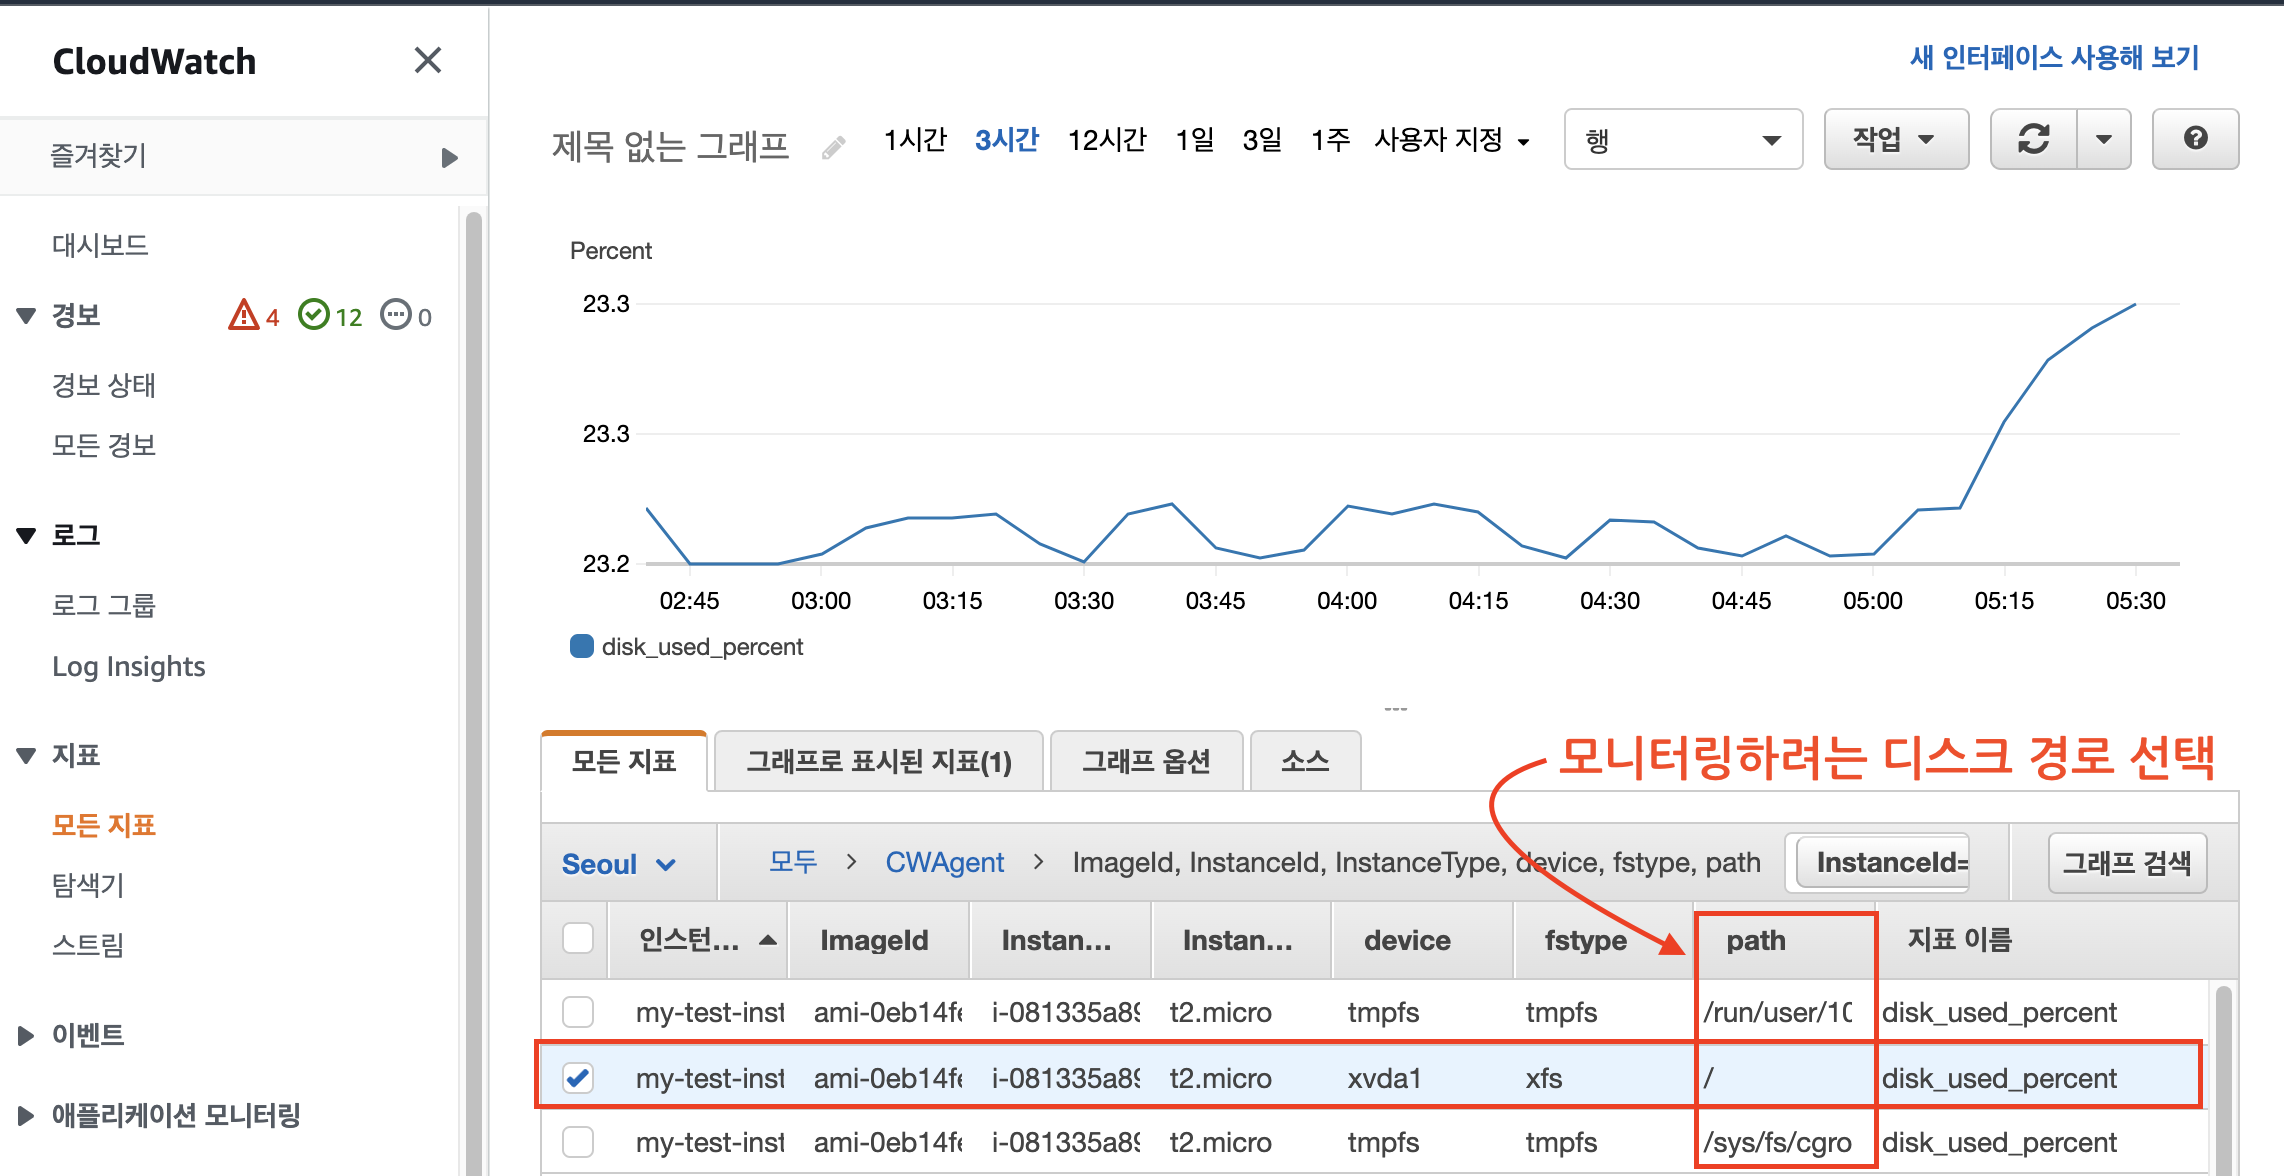
지표 목록이 보이는데, 그 중 모니터링하고자 하는 경로 (ex, / )를 클릭합니다.
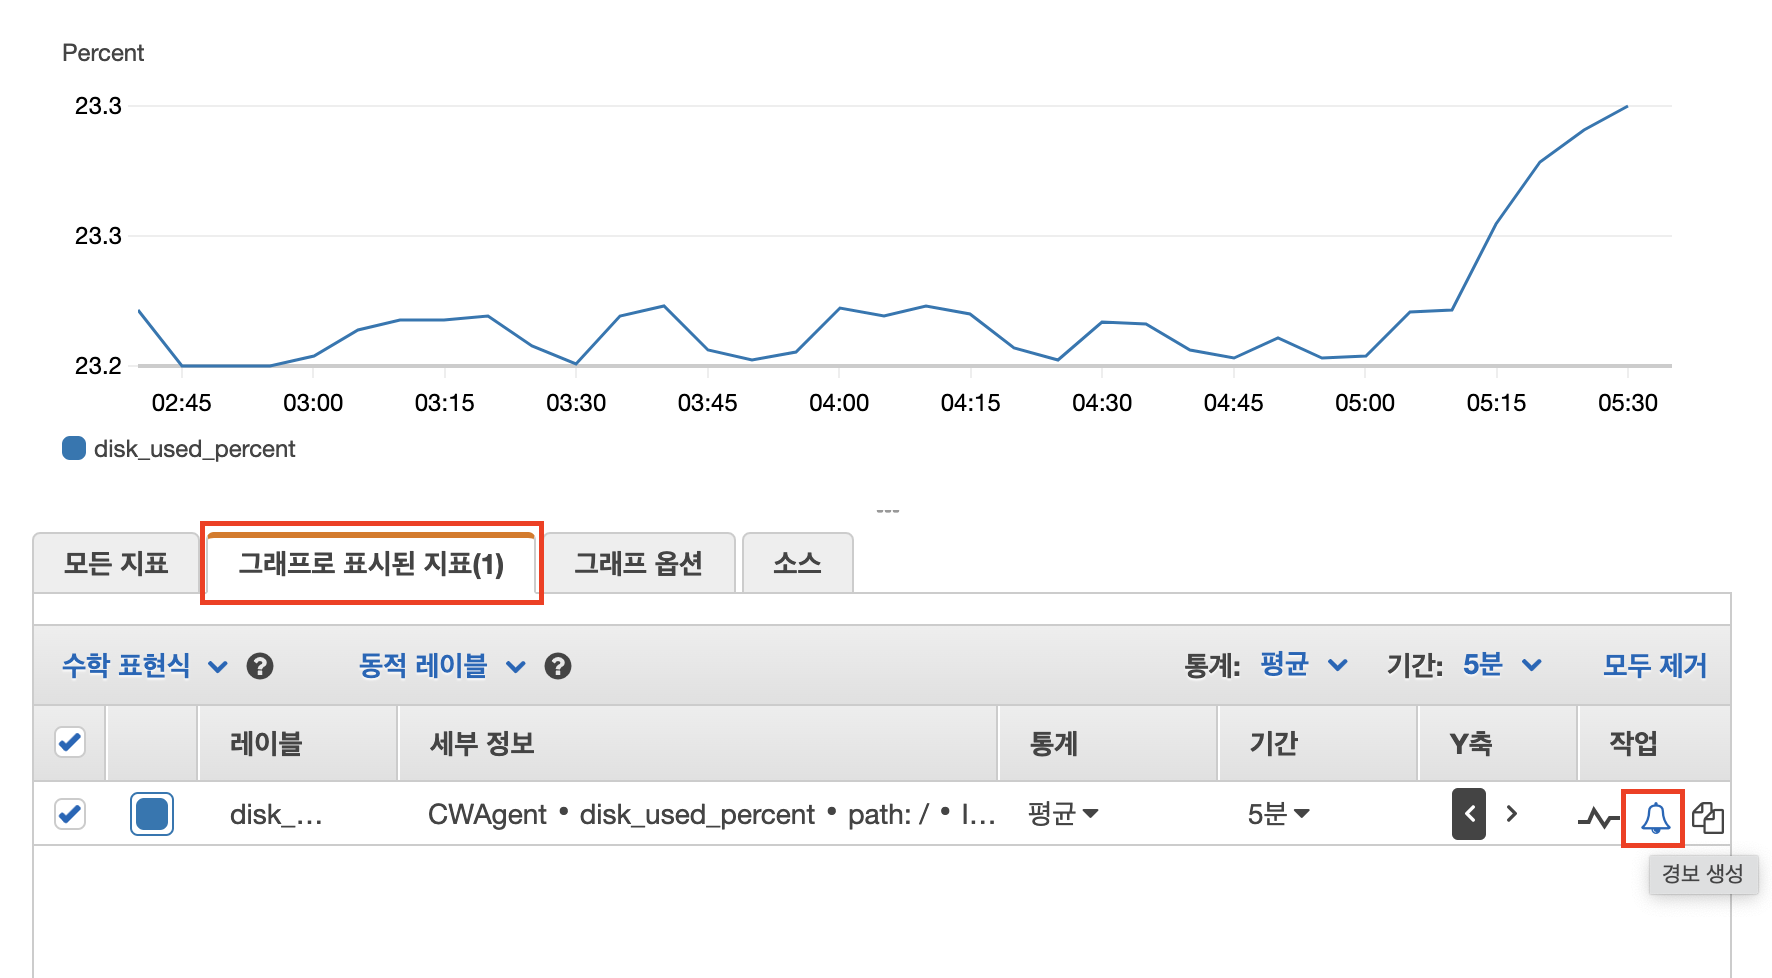
그래프로 표시된 지표 탭을 선택하고, 경보생성을 클릭합니다.
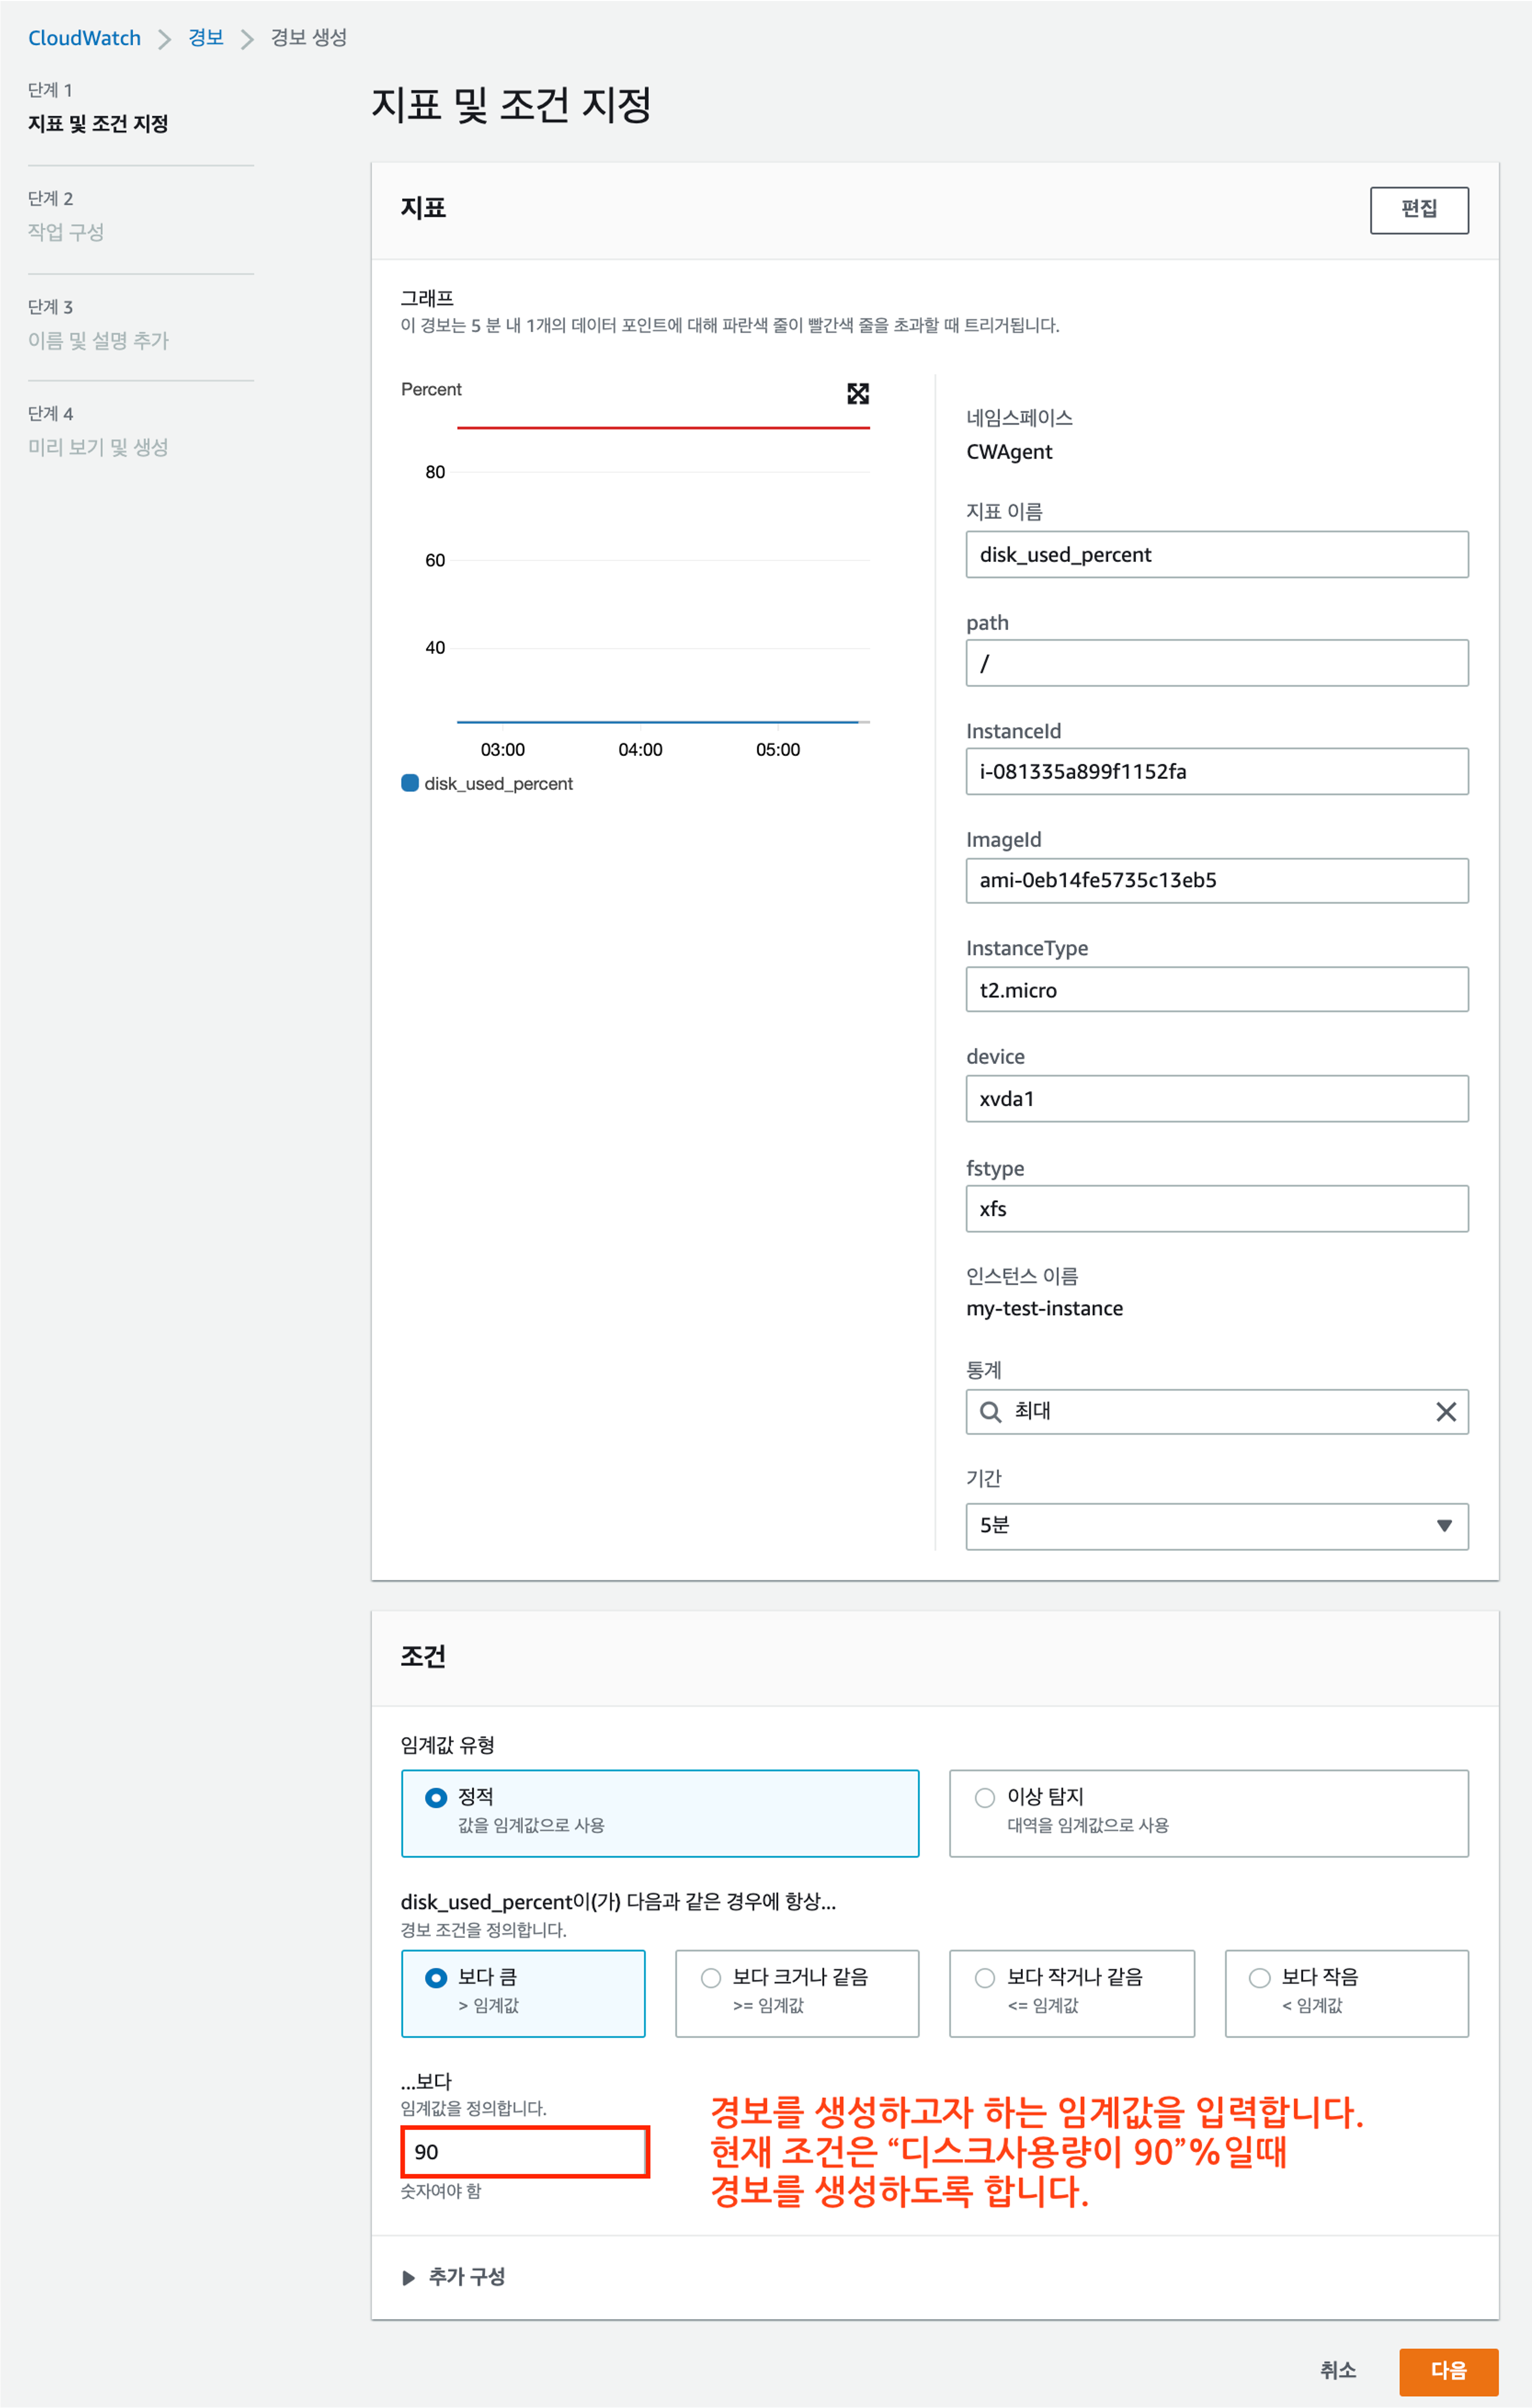
지표 조건을 입력합니다.
아래 설정의 경우 디스크 사용량이 90%일때 경보를 생성하도록 조건을 지정했습니다.
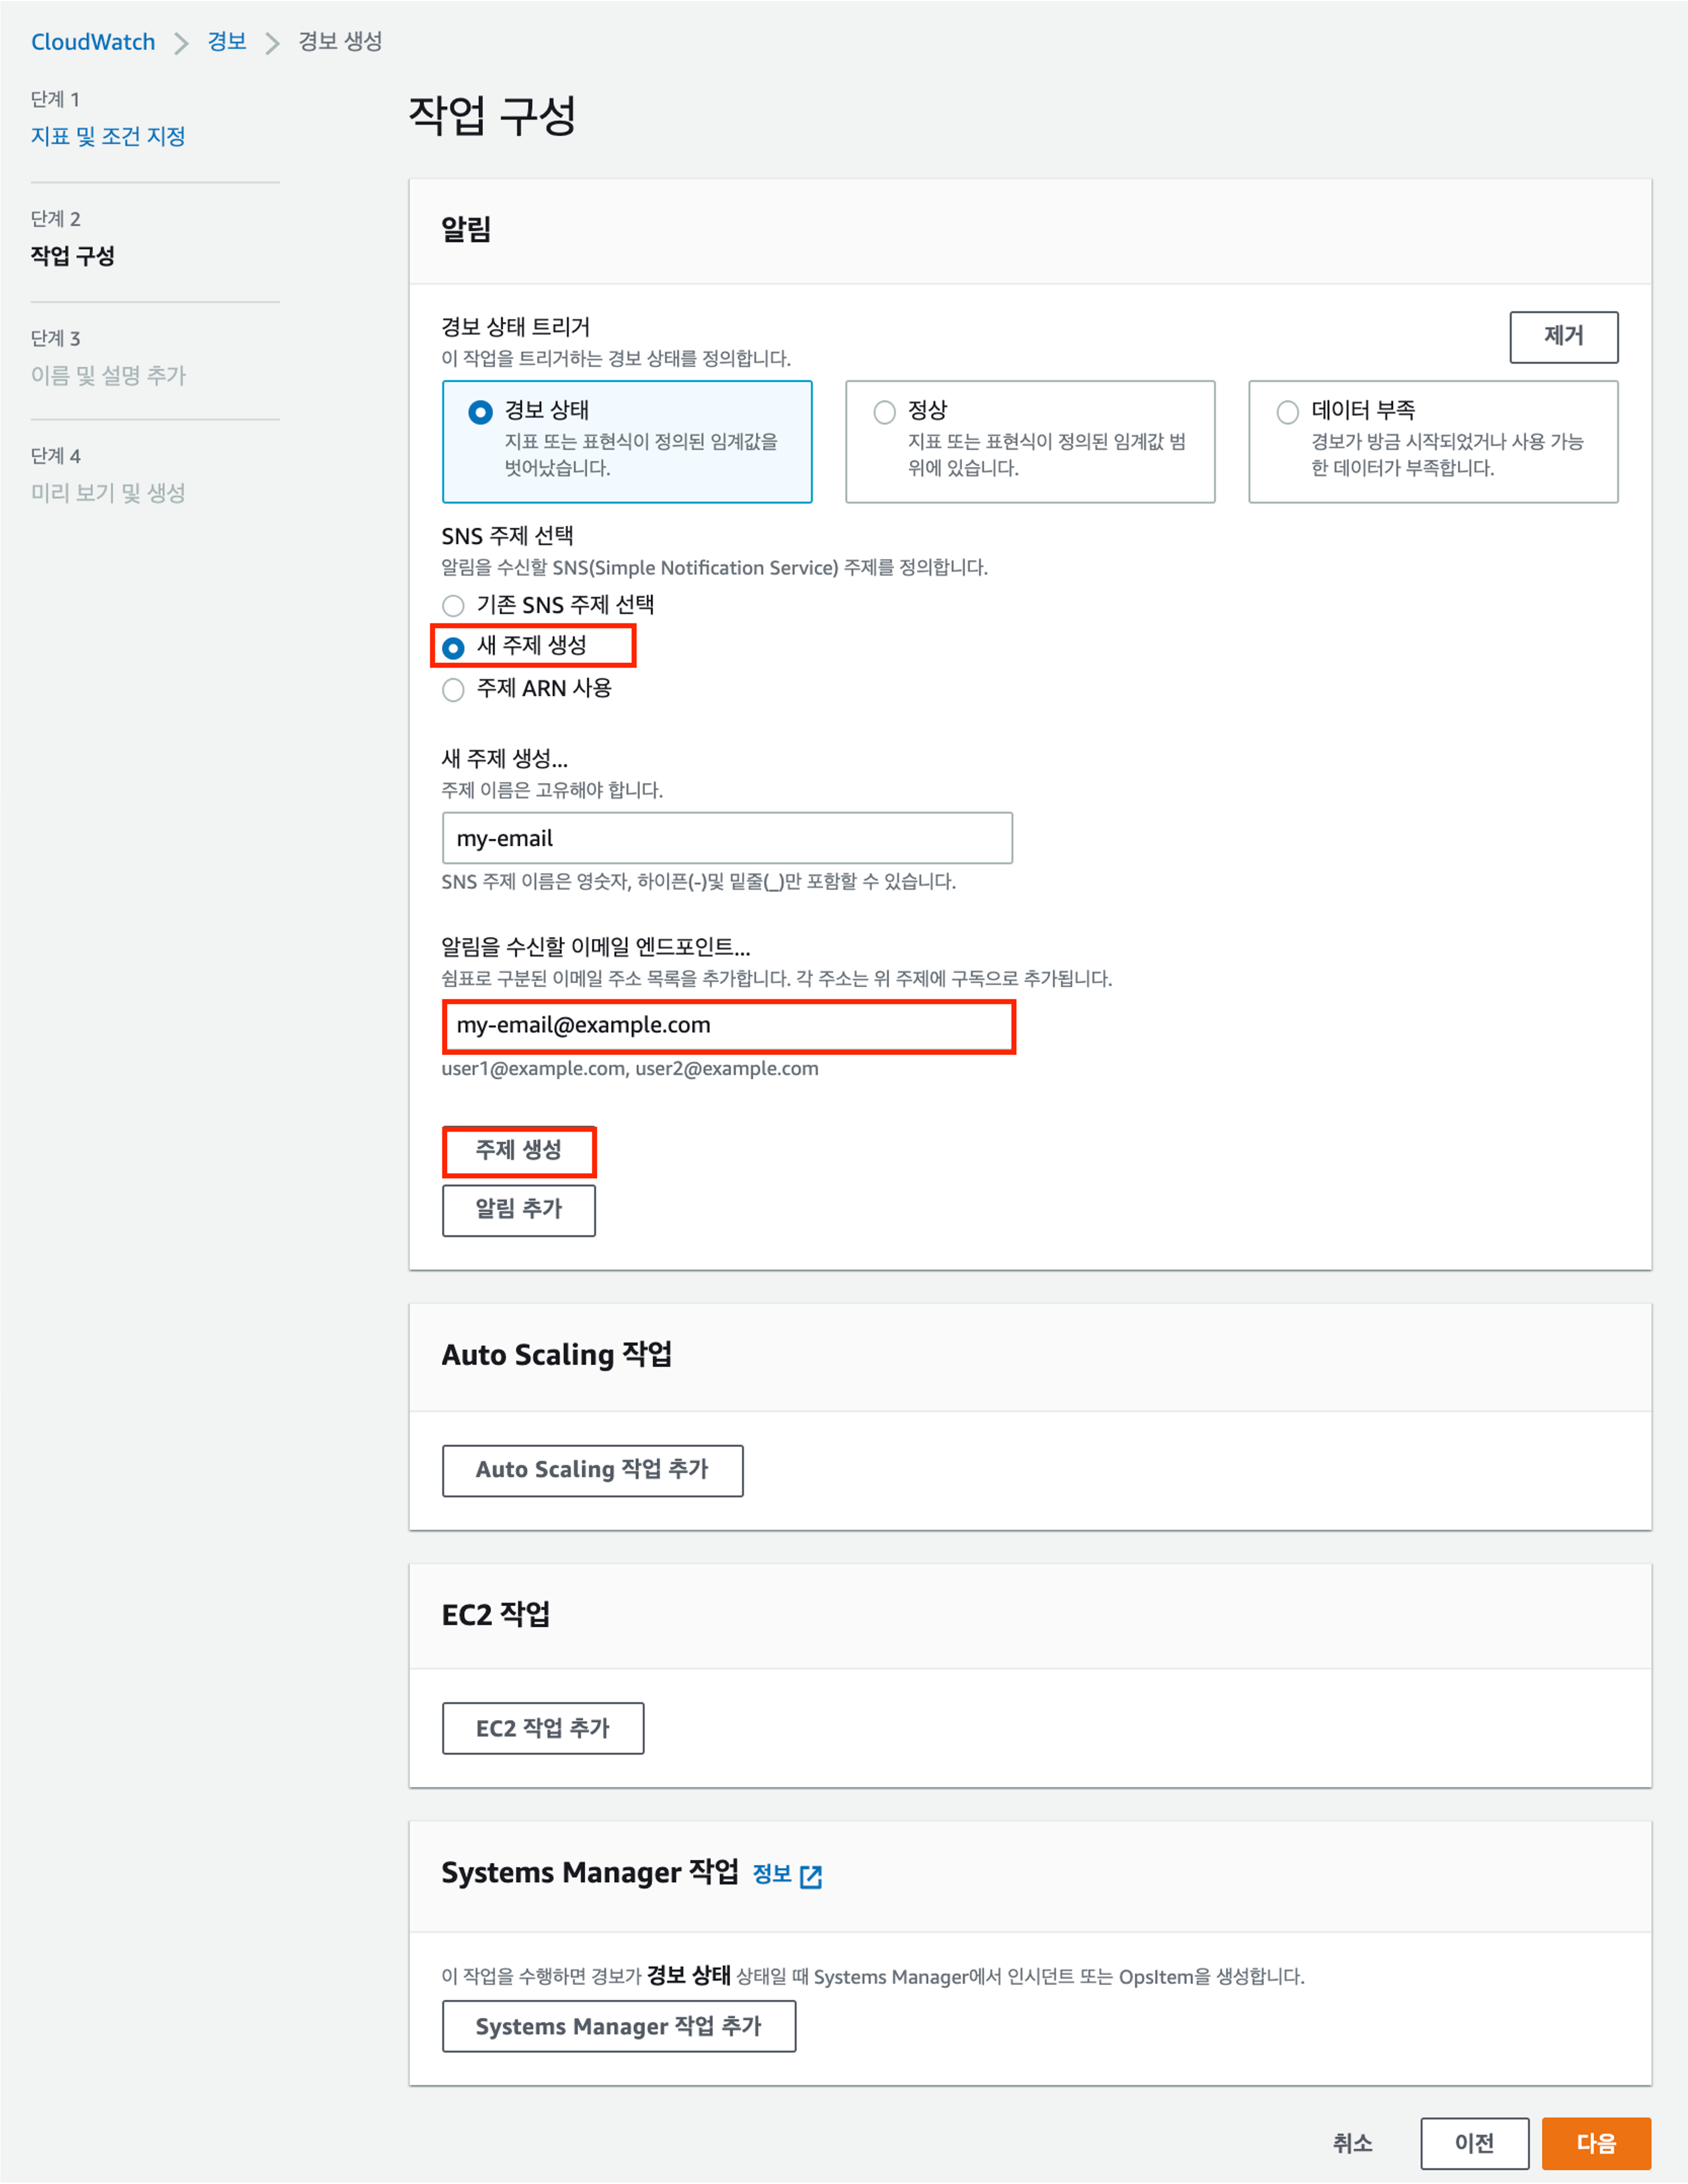
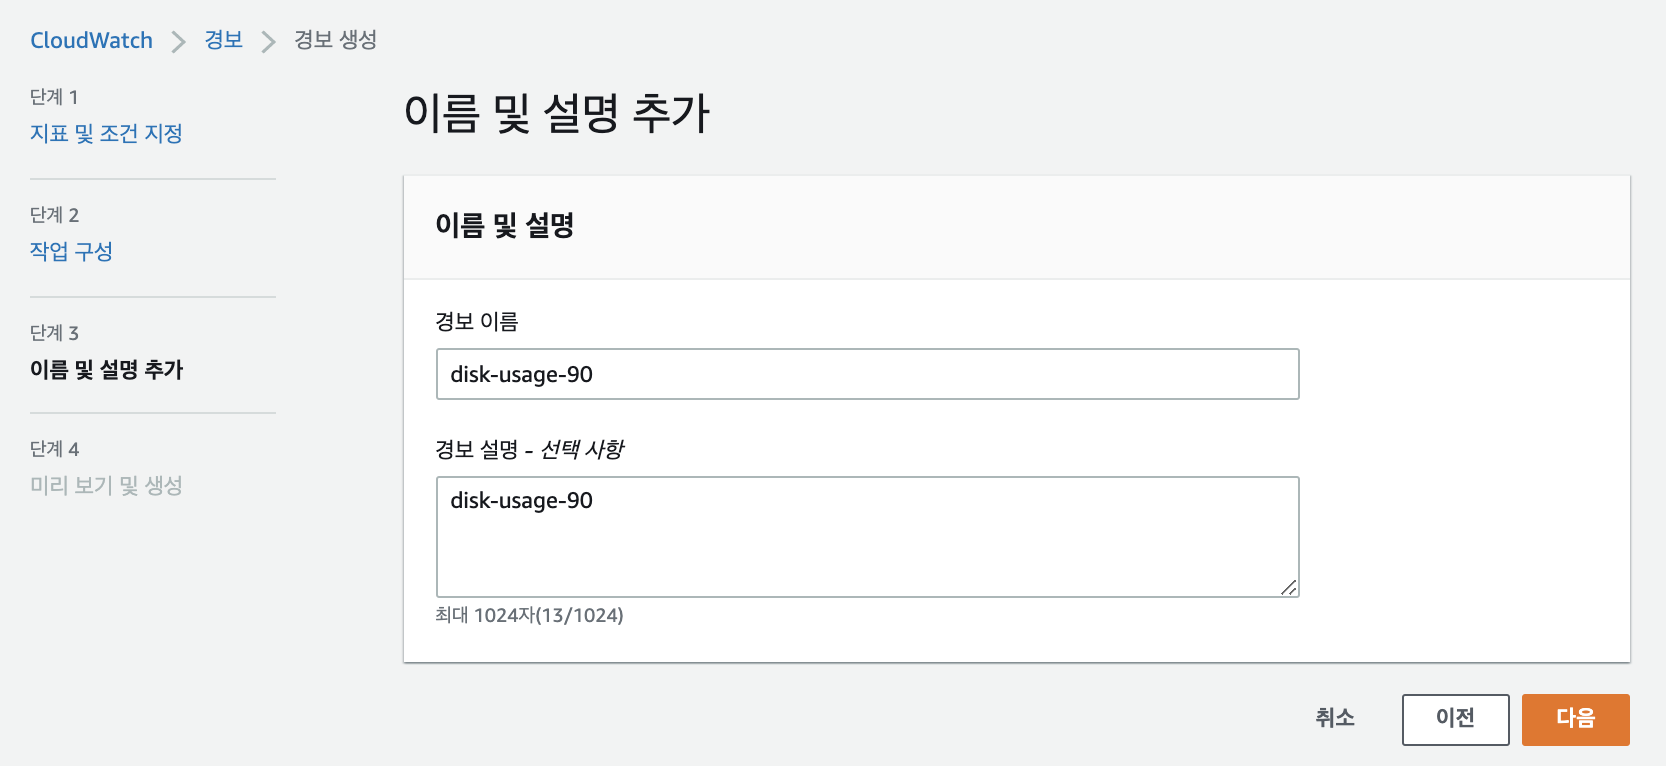
경보 이름을 입력하고, 다음을 클릭하여 생성합니다.
경보 생성이 완료되었습니다.
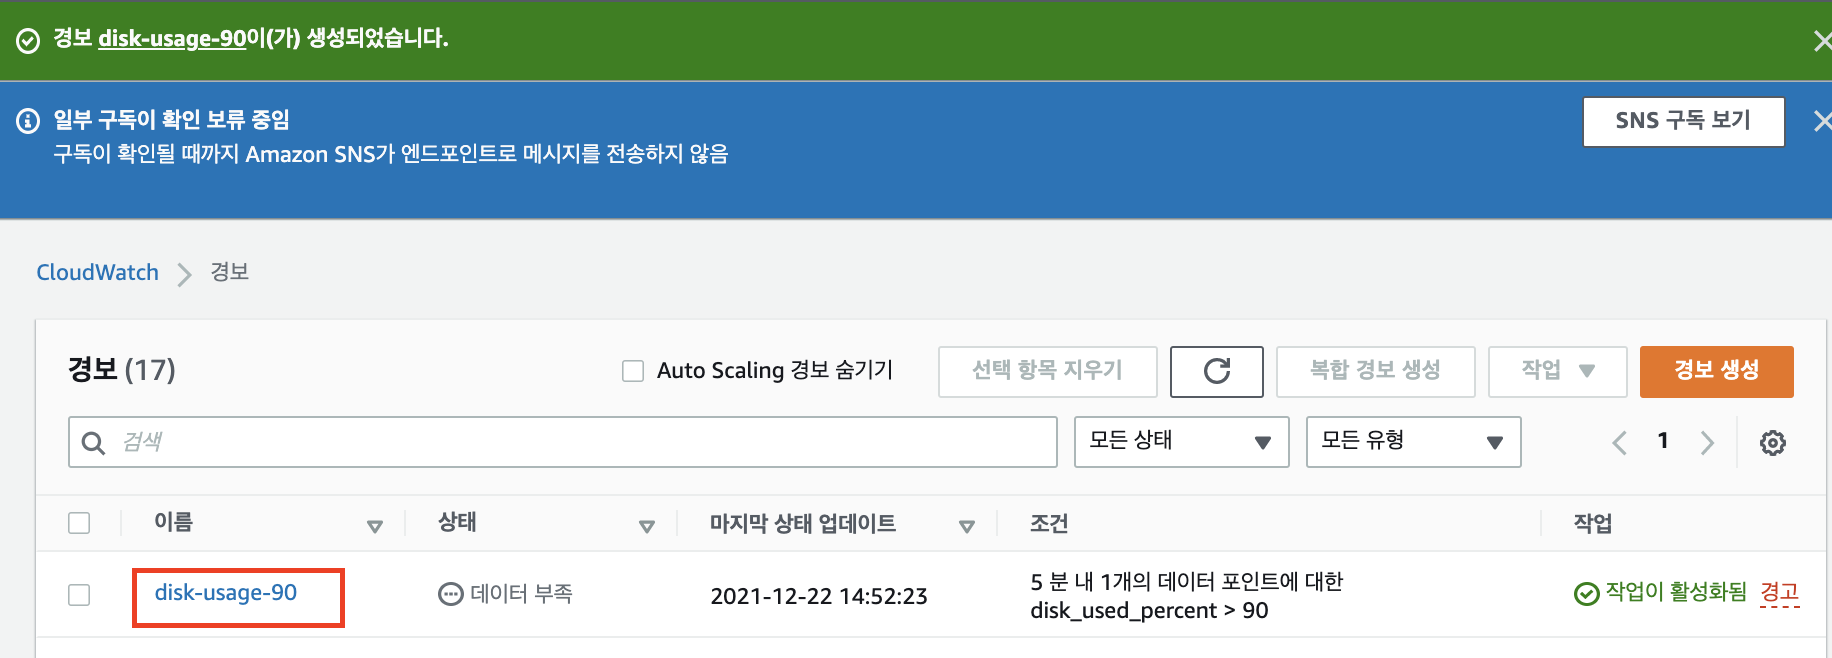
이제, 위에서 등록한 이메일에 구독 확인을 위한 이메일이 발송 되어있습니다. 이메일 인증을 완료하세요.!!